Can you believe the weather this week? Thunder, lightning, tornado warnings, hail, several inches of rain! Hard to believe we're in southern California. I just took these pictures from the classroom...4:40pm on Friday afternoon. Check out the hail!! 

 here blocks of rock have moved past each other. There are 3 types of faults. Normal faults occur as a result of tension. The hanging wall moves down relative to the footwall. Reverse faults are caused by compresion. In this case, the hanging wall moves up. Shearing causes rocks to slide past each other and creates a strike-slip fault. The San Andreas fault is a strike-slip fault.
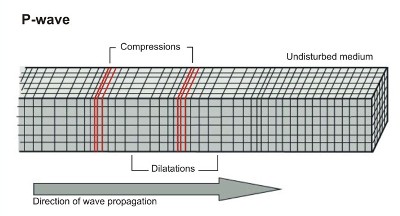
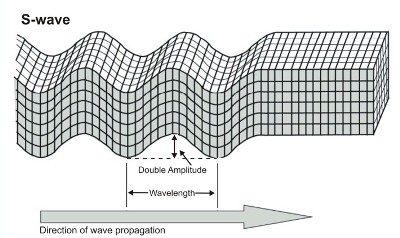
 These seismic waves can tell us a lot about an earthquake. When detected at a seismograph, scientists can use the data to help determine the size of the earthquake and the epicenter. The determine the distance to the epicenter, first determine the time between the arrival of the p-wave and s-waves at a seismograph station. Then use the graph to determine the distace to the epicenter. Next, use a compass to draw a circle around the location of the seismograph station. Repaet this process for 2 other siesmograph stations. The epicenter is located where the 3 cirlces overlap. To practice this, visit the virtual earthquake website.
